How Match Data & Statistics Are Used in Modern Cricket(2026)
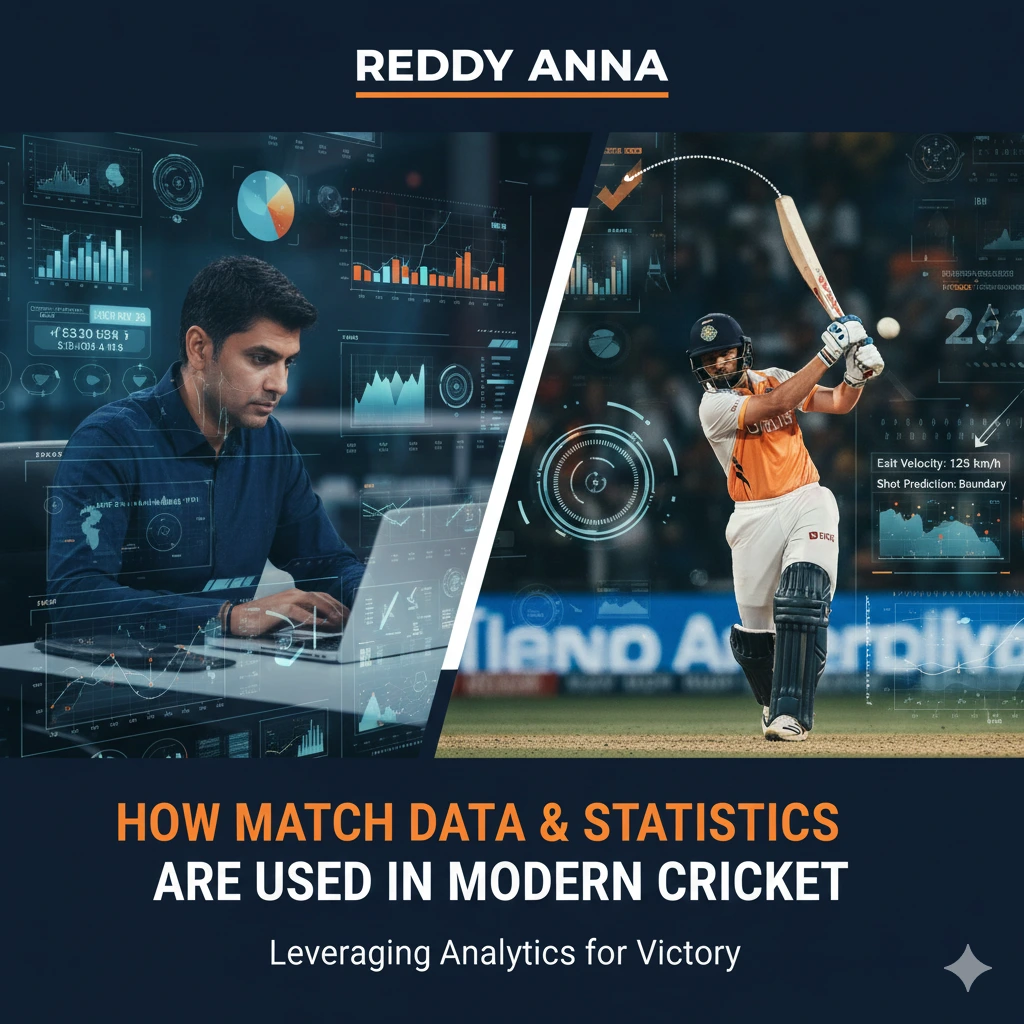
Cricket has always been a game of numbers, but modern cricket has turned numbers into decision-making power. Earlier, fans discussed runs, wickets, and centuries. Today, teams look deeper, into match-ups, phase-wise strike rates, dot-ball pressure, and even “expected” outcomes based on similar ball patterns. That evolution is why cricket match statistics are no longer just a scoreboard summary; they’re now a strategic weapon.
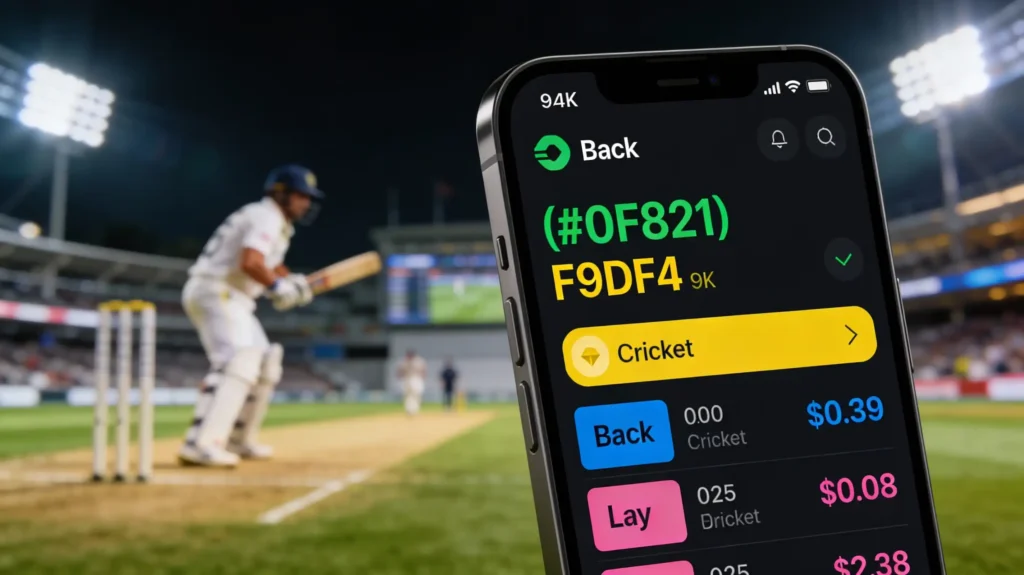
Whether you’re a cricket fan trying to understand why captains make unusual choices, or you follow match predictions and live analysis on platforms like Reddy Anna, the reality is simple: the sport is being shaped by data. The team that reads match trends faster often gains an edge, especially in T20,s where the smallest advantage can decide the game.
In this blog, we’ll break down cricket analytics basics, explain why metrics like strike rate and economy rate matter more than ever, and show how professionals use cricket data analysis and advanced cricket metrics to evaluate performance beyond what traditional stats reveal.
Table of Contents
1. Why Cricket Match Statistics Matter More in 2026
In 2026, cricket is played at a higher pace, under tighter scrutiny, and with far more tactical planning than ever before. With leagues like IPL, BBL, SA20, and international schedules packed year-round, teams cannot rely only on “form” or gut-feeling selection. They need objective signals, numbers that show repeatable patterns and weaknesses. That is where cricket match statistics become essential.
A modern analyst doesn’t just ask, “How many runs did he score?”
They ask:
- When did he score those runs, powerplay or death overs?
- Against pace or spin?
- On flat pitches or difficult surfaces?
- Did he score freely or consume deliveries under pressure?
These questions matter because performance in cricket is highly situational. A 40(22) in the death overs can be more valuable than a slow 65(55), depending on the match format. So the purpose of match data isn’t just recording; it’s explaining performance with context.
On fan platforms like Reddy Anna, where cricket discussion is fast and match-by-match, learning statistics properly gives you a smarter way to understand outcomes and avoid surface-level conclusions. It makes the sport more logical, more predictable, and honestly, more interesting.
2. Cricket Analytics Basics: The Shift from Scoreboard to Strategy
To understand cricket analytics basics, you need to see cricket like a series of repeatable events:
- A ball is bowled with a specific line and length
- A batter responds based on skill, intent, and situation
- The field setting forces risk or rewards
- pitch conditions influence outcome
Modern analytics tracks all of it. Analysts don’t treat a batter as “good” or “bad.” They treat him as:
- stronger vs pace than spin
- Weaker early in innings, but dominant after getting set
- high boundary % but poor against slower balls
- effective only in specific phases
This is why analytics is sometimes called “pattern intelligence.” It turns cricket into measurable behaviour.
A strong example is how teams now plan overs based on data:
- Who bowls 2 overs in powerplay
- Who holds one over for the 18th
- Which bowler targets specific batters with short ball plans
If you follow match insights on Reddy Anna, you’ll notice the discussion often focuses not only on “who won,” but why certain moments shifted the match. That “why” is powered by analytics.
3. Key Types of Cricket Data Used Today
Let’s break down what’s included in modern cricket match statistics beyond just runs and wickets.
A) Ball-by-ball data
This includes:
- dot balls
- singles vs boundaries
- balls faced vs balls remaining
- pressure overs (low-scoring clusters)
B) Phase-wise data
Most crucial in T20/ODIs:
- Powerplay: overs 1–6
- Middle overs: overs 7–15
- Death overs: overs 16–20
A batter’s strike rate in overs 16–20 is often the biggest predictor of match outcomes.
C) Match-up data
This is the hidden gold of cricket data analysis:
- Batter vs bowler history
- Batter vs bowler type (left-arm pace, leg spin, off spin)
- Boundary% vs wicket probability per match-up
D) Fielding and running data
Modern teams track:
- misfields
- catching success rate
- direct hit accuracy
- 1s-to-2s conversion rate
Cricket has become a sport where “small” runs now decide big matches.

4. Strike Rate vs Average: What Truly Defines a Batter?
The debate of strike rate vs average is one of the most important discussions in modern cricket.
Batting Average = Consistency
Batting average tells you how many runs a batter scores per dismissal. It rewards stability.
Strike Rate = Impact
Strike rate tells you how fast a batter scores per 100 balls. It rewards aggression and matches influence.
Here’s the truth:
In T20 cricket, strike rate often matters more than average.
Why? Because a batter who scores 30(15) creates a scoring platform. Even if he gets out, he has shifted the required run rate.
But in Tests, the average is far more important because building innings matters.
That’s why modern analytics does not choose one metric. It uses both, plus context:
- strike rate by phase
- boundary %
- dot-ball %
- dismissal rate vs match-ups
On Reddy Anna’s discussions, the smartest comparisons are the ones that separate formats. A batter can be “elite” in T20 while being average in ODIs, purely because strike rate demands are different.
5. Economy Rate Explained (and Why Context Matters)
If you want an economy rate explained in a modern cricket lens, you must understand that economy is not always equal to quality.
Economy rate = runs conceded per over.
Simple definition, but the meaning changes by context.
A bowler with an economy of 7.5 might be:
- excellent in death overs
- poor in the middle overs
- average overall
Similarly, a bowler with an economy of 6.0 could be:
- bowling safe overs when pressure is low
- protected from big hitters
- bowling only in favorable match-ups
So modern cricket analytics basics compare economy across:
- phases (PP vs middle vs death)
- pitch types (flat vs slow vs swinging)
- match-ups (vs right-handers vs left-handers)
Today’s best analysts use “relative economy” (economy compared to the match average) rather than raw economy.
6. Advanced Cricket Metrics Used by Analysts
Now let’s talk about advanced cricket metrics, the next level beyond traditional stats.
1) Dot Ball %
Dot balls create pressure. Pressure creates wickets.
A batter witha high dot ball % often:
- struggles early
- scores in bursts rather than flow
- creates risk for the partner
2) Boundary %
Shows how much of the scoring comes from boundaries. A high boundary % is crucial in T20.
3) Control %
Used in ball-tracking data. Measures how often the batter “controls” shots.
4) Expected Runs (xR) and Expected Wickets (xW)
Models like CricViz use ball attributes (speed, swing, line, length) to estimate threat and outcomes.
5) Win Probability
Live win probability changes ball-by-ball. It’s why one over can swing a match chances.
7. How Teams Use Data for Match-Ups and Game Plans
This is where cricket gets fascinating.
Teams now build strategies like:
- “Bowler X bowls to Batter Y whenever he arrives.”
- “Batter Z attacks spin early before the field spreads.”
- “In death overs, avoid slot balls; bowl wide yorkers.”
Match-ups are often decided using ball-by-ball history from databases like ESPNcricinfo Statsguru.
This is why you’ll see:
- unusual promotions in the batting order
- Specific bowlers held back for one batter
- early, spinner overs inthe powerplay
These aren’t random tactics. They come from cricket data analysis models.
And yes, this is exactly why platforms like Reddy Anna focus heavily on deeper match insights and player evaluation instead of only final scorecards.
8. How Fans Can Use Cricket Data Analysis Smarter
You don’t need to be a professional analyst to use data well. You just need the right filters.
Quick fan-level analytics checklist
Before judging a player:
- Check strike rate by phase
- Check dismissal type patterns
- Check match-ups vs bowler type
- Compare performance against similar pitch conditions
If you are learning match analysis and want to understand data-driven cricket insights, these Reddy Anna resources help:
- Cricket Player Form Analysis & Fitness Guide (2026)
- Reddy Anna App Download Guide
- Reddy Anna ID Signup Guide
- Betting Tips and Tricks Category
These pages support smarter match understanding and a more structured way of reading cricket games:
Conclusion
Modern cricket is no longer driven by instinct alone; cricket match statistics and cricket data analysis now shape selection, tactics, and match results. When you understand strike rate vs average, get economy rate explained properly, and explore advanced cricket metrics, you start reading matcheaske professionals do. Platforms like Reddy Anna help fans engage with cricket in a smarter, more analytical way. The better you understand data, the clearer the game becomes, and the stronger your match predictions get.
Frequently Asked Question
Q 1: What are cricket match statistics?
Cricket match statistics are detailed numerical insights that explain how a match, player, or team performed. These cricket match statistics include runs scored, wickets taken, strike rate, economy rate, dot balls, partnerships, extras, and phase-wise performance. Modern cricket match statistics help fans, analysts, and bettors understand the game beyond just the final score.
Q 2: What is cricket data analysis in modern cricket?
Cricket data analysis in modern cricket uses advanced cricket match statistics such as ball-by-ball data, powerplay efficiency, death-over impact, player match-ups, and situational patterns. These cricket match statistics help teams and analysts predict performance, plan strategies, and make data-driven decisions more accurately.
Q 3: Which is more important in cricket match statistics: strike rate or average?
In cricket match statistics, the importance of strike rate vs average depends on the format. In T20 cricket, strike rate is more important for measuring impact and momentum, while in Test cricket, batting average reflects consistency and stability. The best cricket match statistics analysis evaluates both metrics together with match conditions and roles.
Q 4: What does economy rate mean in cricket match statistics?
In cricket match statistics, the economy rate measures how many runs a bowler concedes per over. While the basic economy rate is useful, advanced cricket match statistics compare economy across different phases, such as powerplay, middle overs, and death overs,s to judge true bowling effectiveness.
Q 5: What are advanced cricket match statistics?
Advanced cricket match statistics go beyond traditional numbers and include dot ball percentage, boundary percentage, expected runs (xRuns), expected wickets (xWickets), pressure index, and win probability models. These advanced cricket match statistics are widely used for deeper performance evaluation, match prediction, and strategic planning.